2.4 Data Distribution
You can check the data distribution. Go to Data reports ->Data Distribution. You can set the query conditions and the histogram will display.
Pic.24 Data Distribution
2.5 Data Overrange
You can set the normal range for your devices’ measurement. Go to Data reports ->Data Overrange to query the alarm statistics. Set the query conditions and the result will be displayed by pie chart.
Pic.25 Data Overrange
2.6 Data Export
Go to Data Report ->Data Export, click on Export to export the measurement list of specified device to local disk.
Pic.26 Data Export
3. IOT Applications
3.1 Introduction
For users DeviceBit platform provides IOT applications. If you need any help, please send E-mail to service@lewei50.com. .
3.2 Sending Twitter or E-mail
DeviceBit platform also provides functions of binding Twitter, or E-mail. The real-time values of your WIFI Power Monitor can be automatically sent to Twitter, or emailed to the specified E-mail address. Twitter content can also be customized according to different measured values. An example of Twitter auto-sending will be illustrated below. The sending mode of E-mail is basically the same. You can select Twitter or email in the final auto-sending settings.
Cases
This case is to broadcast the power consumption of the office by Twitter at different times(8:00am, 14:00 pm, 20:00 pm ). The microblogging content will be different according to different measured values. Please see the following example:
【DeviceBit NOTICE】2014-04-09 14:00,Total Energy 27KWH, Max. Power 3047 W, Min. Power 26W, Average Power 374W (http://www.devicebit.com/u/g/3837)
Setting steps:
Step 1 Bind Twitter account. First, login to DeviceBit platform, go to My Account ->Twitter
Pic.27 Bind Twitter
Click on Bind, a page will appear as follows:
Pic.28 Twitter
Enter your username and password, click on Authorize App and your Twitter account will be successfully binded. Note: If you have already login to Twitter, the system will automatically bind your account, and the login page will not appear. If you want to bind another account, you need to logout your Twitter first and restart IE browser before binding.
Note: For account security, the website to bind Twitter is api.twitter.com URL address.
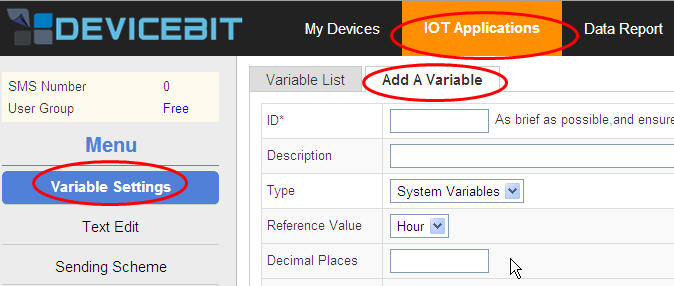
Step 2 Set up variables. Click on IOT applications on the top, go to the menu on the left, and click on Variables Settings. Different Twitter sending content is defined according to different system variables or the measured value range of the sensor.
Pic.29 Variable Settings
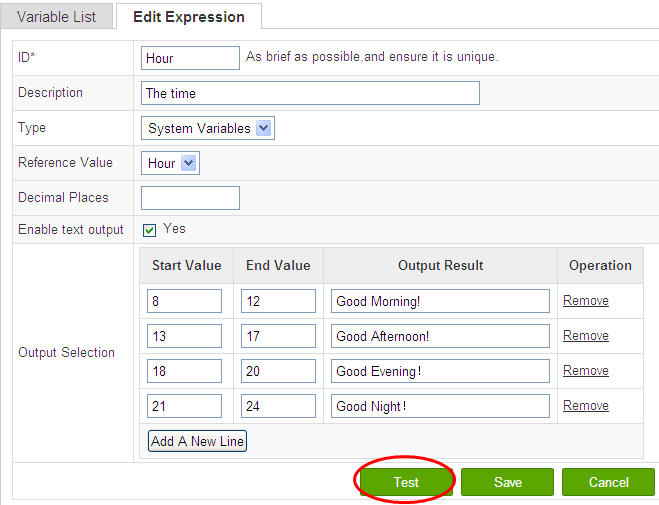
First, set different Twitter content, Good morning, Good afternoon or Good evening according to the system variable Hour. Click on Add Expressions, and fill in the information as follows:
Pic.30 Hour Settings
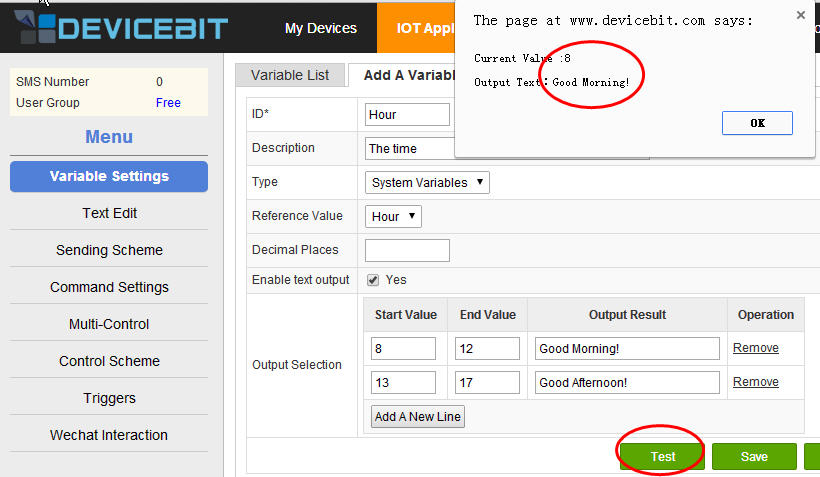
Note for Type select System Variables . The system variables including the hour , date , and time. Select Hour here. Decimal Places leave blank, for decimal is not involved here. Enable output text output tick Yes. Then, click on Test, we can see that the current time is 8 o’clock, and the text is Good Morning! (For the time is at the range 8-12)
Pic.31 Test For Hour
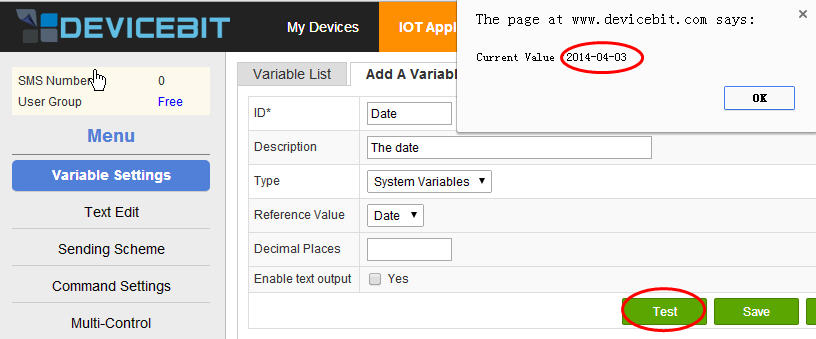
Next, set up Date in the same way. Settings for date are very simple. Ignore Enable text output for there is no need to set it. The settings and test results are as follows:
Pic.32 Settings &Test For Date
Finally, set the Twitter text according to different measured power values. Here, select Sensor Statistics for Type, select WIFI Power Monitor and Power for Reference Value. Since all the values are integers, the decimal places do not need to be set. If the measured values are decimals, you can set the decimal places here. The format is .0, .00 and so on. Then, click on Test to check the result.
Pic.33 Settings & Test For Average Power
The above settings for variables are complete. Of course, there are more settings for more complex logical relationships. You can select Sensor Statistics for Type, and Max. or Min. and so on for Statistics Method. You can select multiple sensors and do more researches by yourself.
Pic.34 Settings & Test For Max. Power
Pic.35 Settings & Test For Min. Power
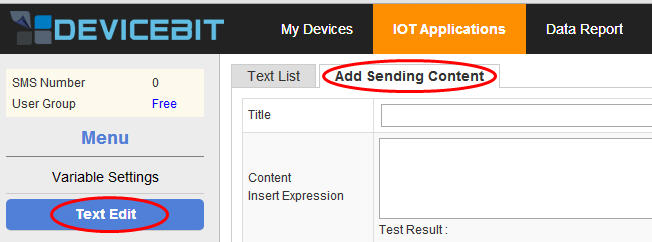
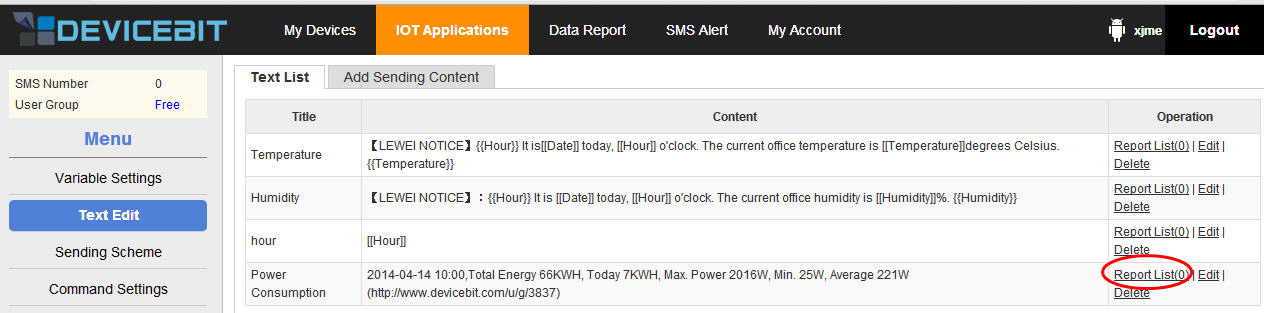
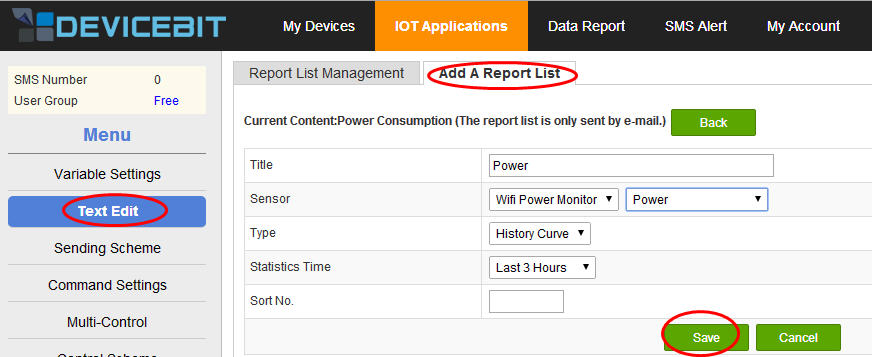
Step 3 Edit text: Click on Text Edit ->Add Sending Content
Pic.36 Text Edit
The settings and test result are as follows.
Pic.37 Settings & Test For Text
The returned content for [[ ]] is the returned value of the system variable in [[ ]], the measured value of the sensor in [[ ]], or the more complex logic operation result of the measured values of the sensor in [[ ]]. For example, the returned content for [[date]] is the current date. While, the content for the two braces {{}} is the Twitter Text corresponding with the value range of the variable in {{}}. After setting up, you can click on Test to see whether the settings are correct.
Step 4 Set up auto-sending settings. This step is very simple. Click on Sending Scheme ->Add Auto-sending Settings. SelectTwitter for the Sending Type. Select Every Day for the Repeat Type. Tick the time, for example 8:00, 16:00, and 20:00. Then the text content will be sent to Twitter automatically at 8:00am, 16:00pm, and 20:00pm everyday!
Pic.38 Auto-sending Settings For Twitter
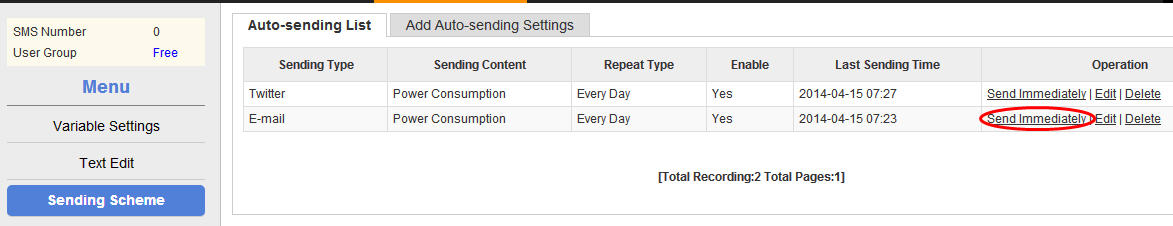
The above settings are all completed. Thus, you can see different Twitter sent automatically at the defined time according to different measured values by your Twitter account bound.
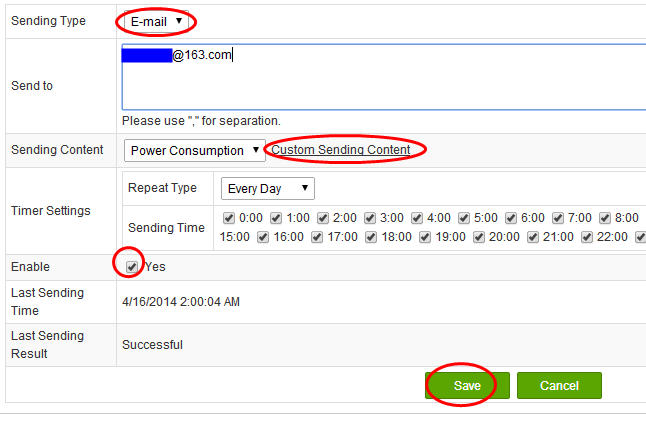
The sending mode for E-mail and SMS is the same with Twitter. Just select E-mail or SMS at Add Auto-sending Settings. After selecting, there will be a blank column for you to fill in the E-mail address or mobile phone number.
Pic.39 Auto-sending Settings For E-mail
3.3 Trigger
The trigger of DeviceBit is the simple form of IFTTT(IF THIS THEN THAT). Different oprations (E-mail, Twitter, or control unit) can be triggered according to one value or value combination (edge trigger is supported).
You can set trigger of power as the following pictures show.
Go to IOT applications -> Triggers ->Add A Trigger
Click on Add A Trigger
Pic.40 Add A Trigger
Then, edit the related information of the trigger.


.jpg)


.jpg)


.jpg)